Design shouldn't be a debate. It should be a decision.
Built on the world's first patented Colour & Design IP, iVisual scores any pack against your Brand DNA in under 5 seconds. Predictive eye-tracking, shelf impact and competitor benchmark, before you print.
The first patented colour & design semantics system.
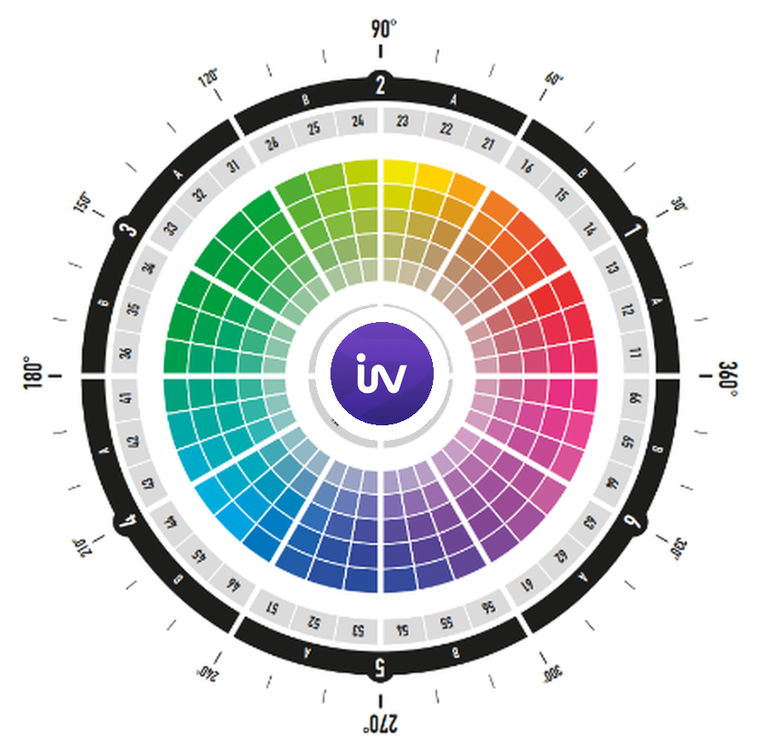
iVisual turns packaging design into measurable data. Built on 20+ years of research, our methodology maps colour and visual design signals to human perception, creating a structured framework to measure what a pack communicates, how it is perceived and how well it aligns with your Brand & Product DNA. Colour is where it started. The software now reads the full system of signals on a pack, which is what the next part explains.
It's not about taste. It's a neurological decision.
iVisual · 2026
What the software reads
We don't just analyse what a pack looks like. We measure what it communicates.
Every pack is a system of visual and semantic signals. iVisual reads these signals individually and together, then validates them against your Brand & Product DNA, target audience and intended positioning.
Colour & visual codes
Every colour is interpreted through our patented methodology and measured against its semantic meaning, brand values, archetypes, product positioning and category expectations.
Hierarchy & structure
We analyse layout, proportion, contrast and visual hierarchy to determine what gets noticed first, and whether that order supports what the pack needs to communicate.
Brand & consumer meaning
We measure whether the design expresses the intended brand values, archetypes and positioning, and whether those signals align with the target audience.
Communication & shelf performance
Typography, claims, imagery and key pack elements are analysed for clarity and visibility, then validated through predictive attention and shelf-performance analysis.
The first patented colour & design semantics system.
iVisual turns packaging design into measurable data. Built on 20+ years of research, our methodology maps colour and visual design signals to human perception, creating a structured framework to measure what a pack communicates, how it is perceived and how well it aligns with your Brand & Product DNA.
What the software reads
We don't just analyse your packaging we measure what it communicates.
A pack is not one impression. It is a set of signals the brain processes in a fixed order. iVisual reads each one separately, scores it, and names the correction.
Colour & visual codes
Every colour is interpreted through our patented methodology and measured against its semantic meaning, brand values, archetypes, product positioning and category expectations.
Hierarchy & structure
We analyse layout, proportion, contrast and visual hierarchy to determine what gets noticed first, and whether that order supports what the pack needs to communicate.
Brand & consumer meaning
We measure whether the design expresses the intended brand values, archetypes and positioning, and whether those signals align with the target audience.
Communication & shelf performance
Typography, claims, imagery and key pack elements are analysed for clarity and visibility, then validated through predictive attention and shelf-performance analysis.
One methodology. Three ways to make better decisions.
Brand owners decide faster. Agencies prove the work. Enterprise organisations enforce one standard and automate the process.
Brand owners
Take design decisions faster
Your packaging decision takes 4 weeks. It takes the consumer 0.3 seconds. Structured DNA, predictive shelf performance and competitor benchmark before production spend, so the decision is made once.
Stop defending your creative work and start proving it. A scored rationale next to every route, white-label reports for the client, and three services you can sell without adding headcount.
200 SKU's across 8 markets is not a design problem, it is infrastructure. A Brand DNA library, portfolio-wide audits and reports that feed the approval workflow automatically.
Visual identity, positioning, archetypes and emotional values. The root record every other module reads.
Brand Key model: positioning and value framework
Censydiam: consumer motivation mapping
Jungian archetypes: brand personality alignment
One source of truth across all agencies
Module 02
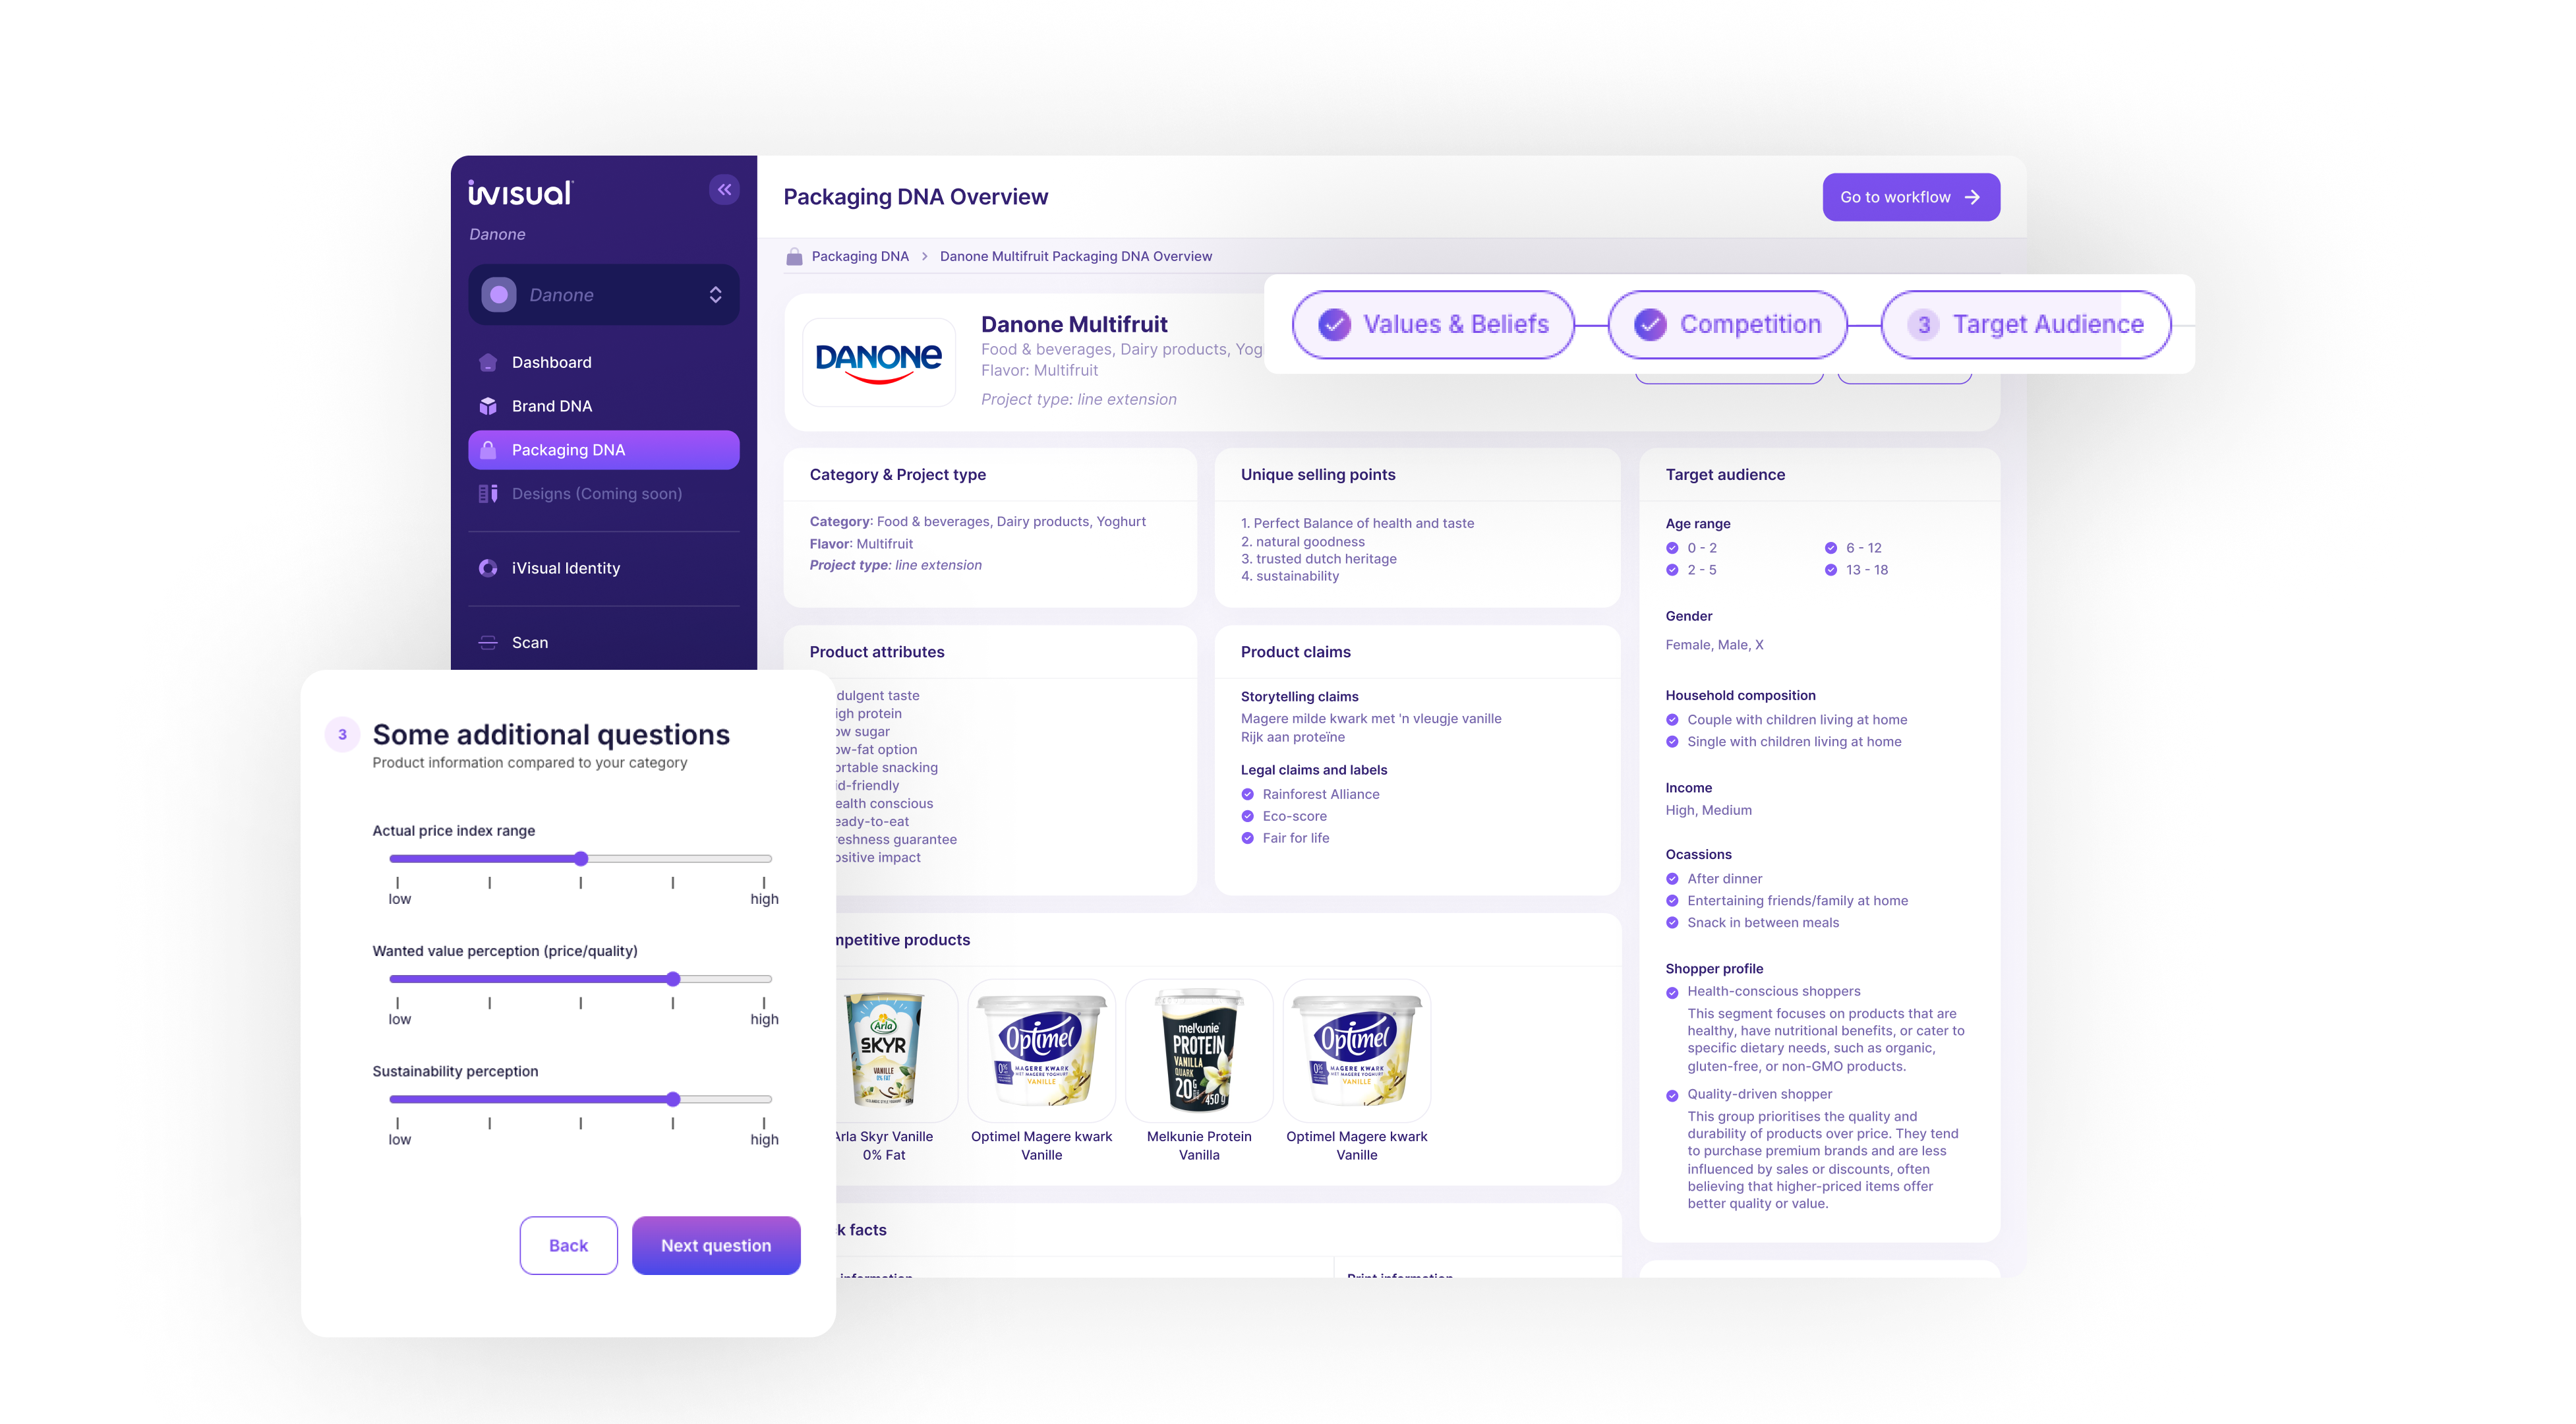
Product DNA
SKU identity: category, attributes, target audience and emotional positioning. Where the brand record becomes specific to the product on shelf.
Product attributes, positioning and differentiation
Category convention: follow or break
Claims and messages that move the purchase
Audience and emotional positioning per SKU
Module 03
iVisual ID
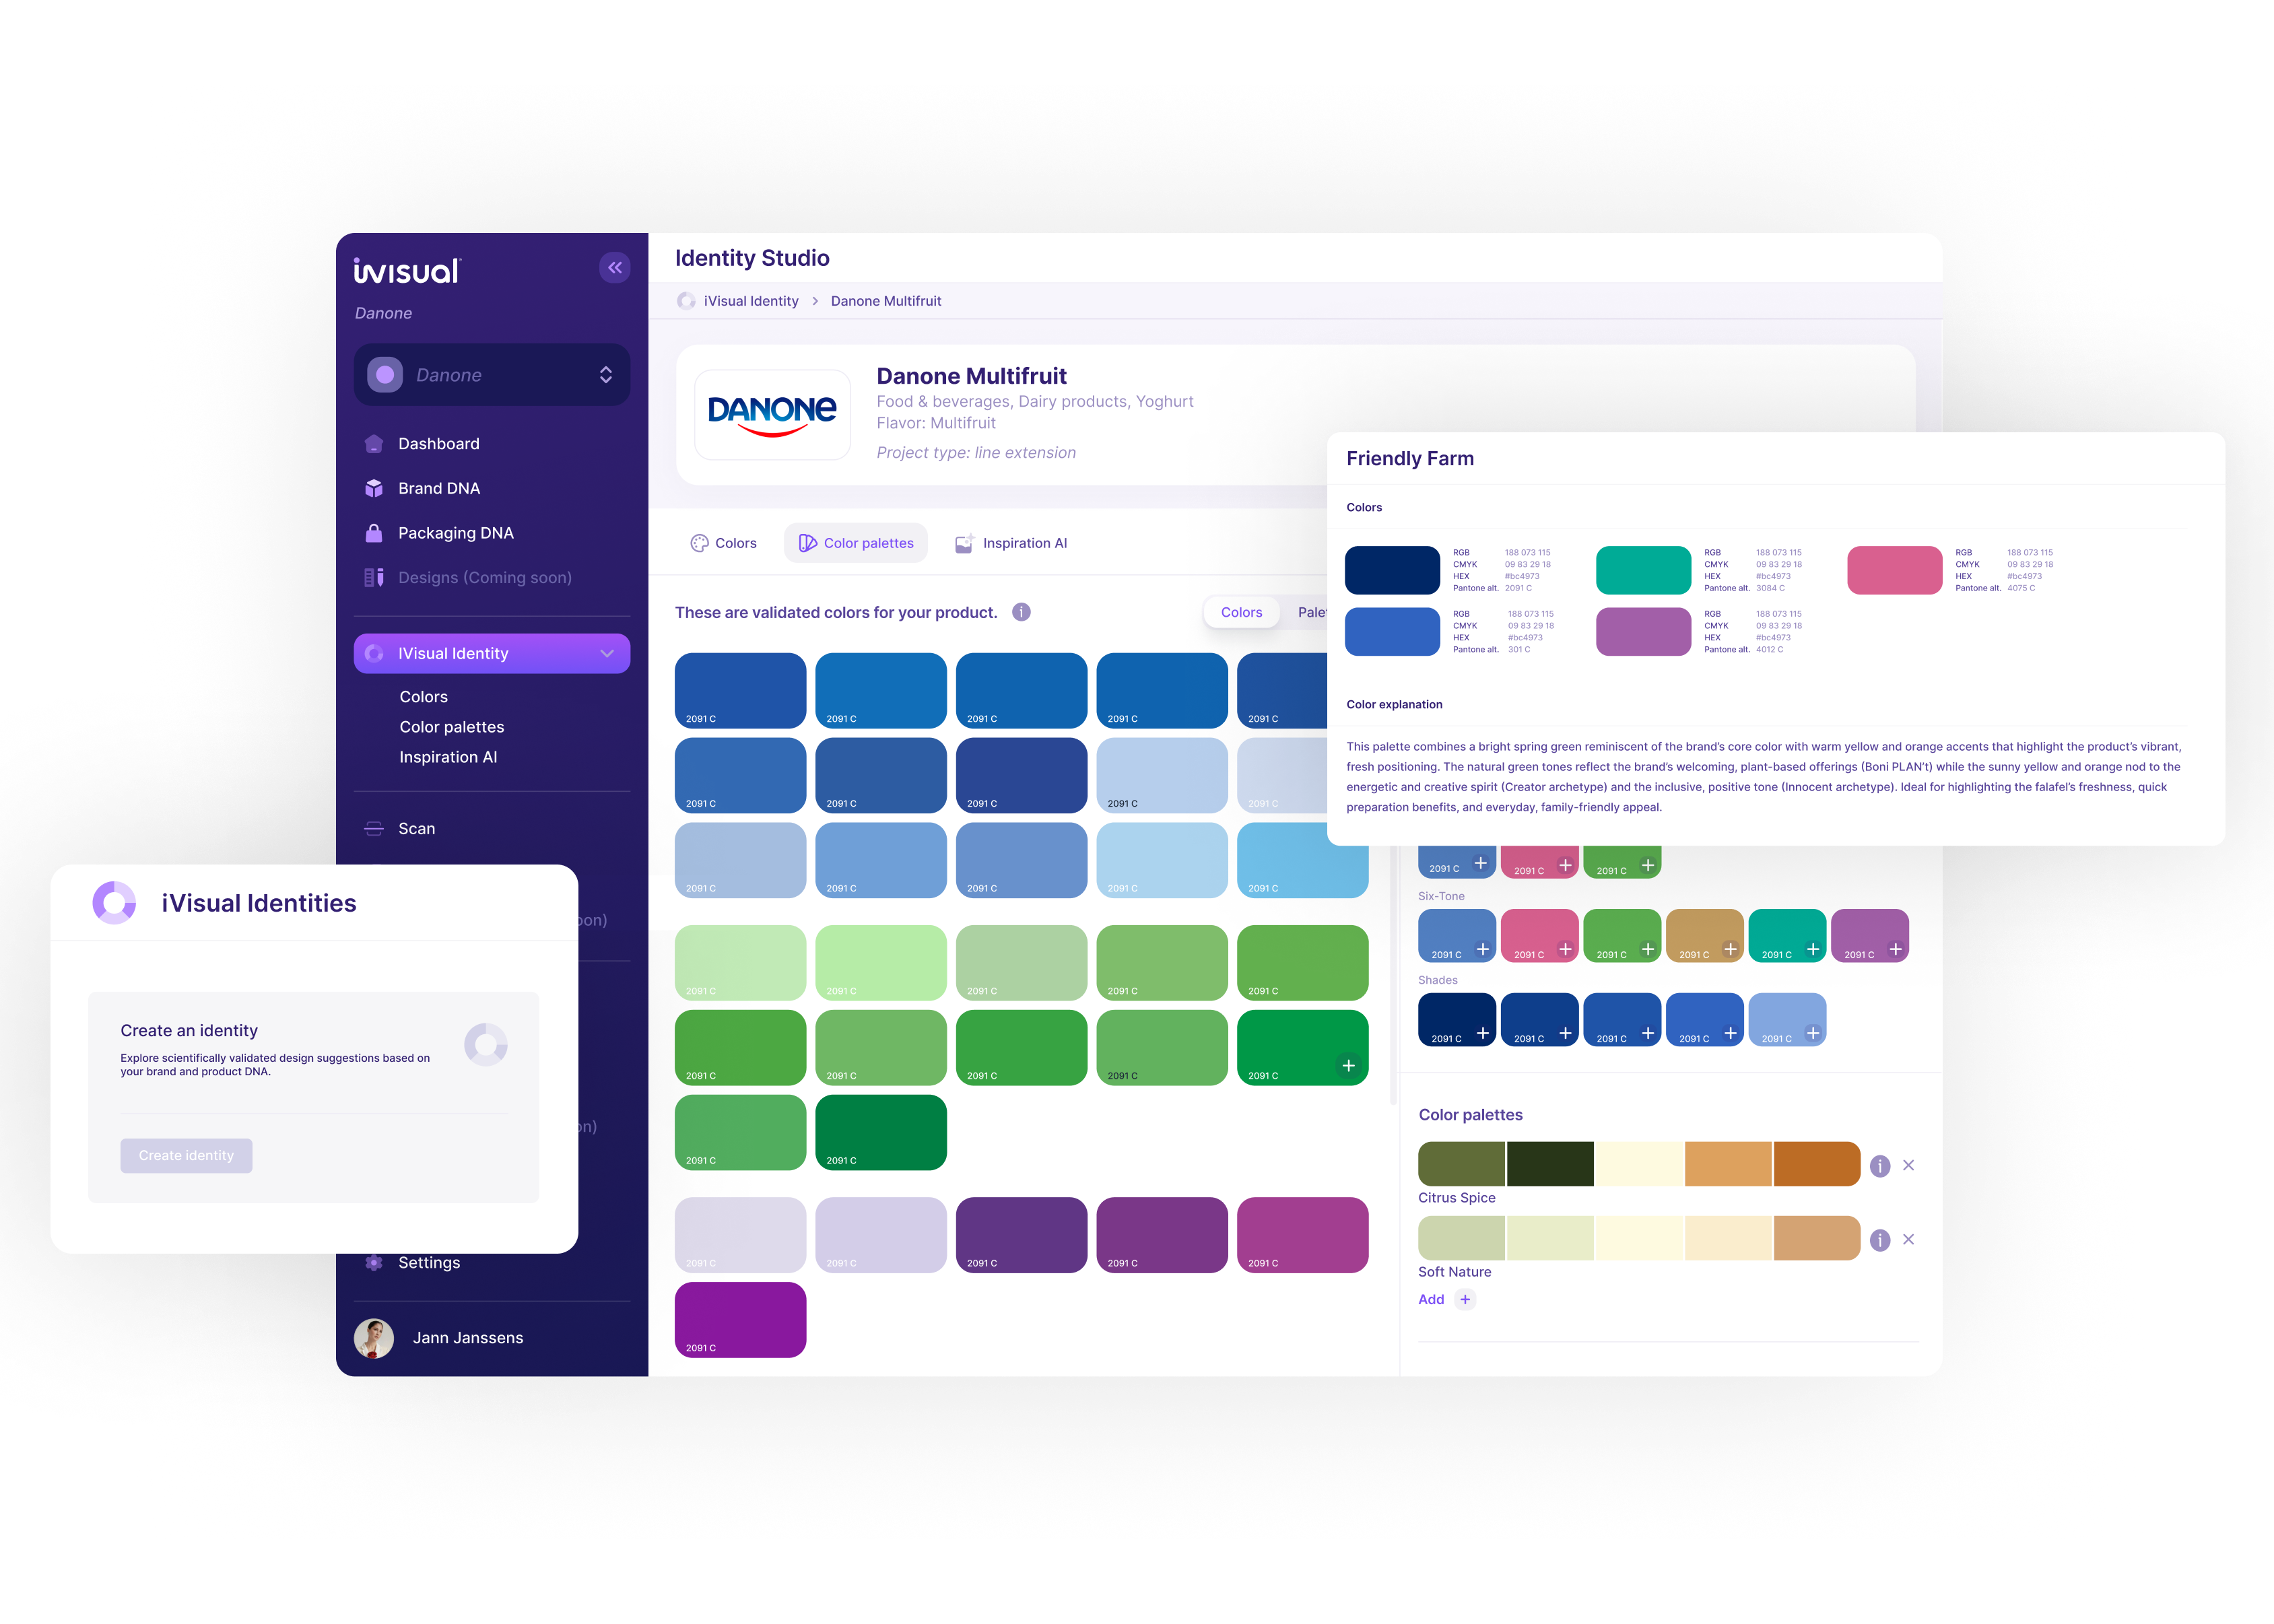
Colours, palettes and creative direction generated from both DNA records. 200+ validated colours, each mapped to behavioural data through the iVisual Methodology.
200 validated colours with behavioural rationale
Palettes generated from Brand and Product DNA
Each colour linked to style, archetype and motivation
The colour debate closes on data
Module 04
GenAI Inspiration
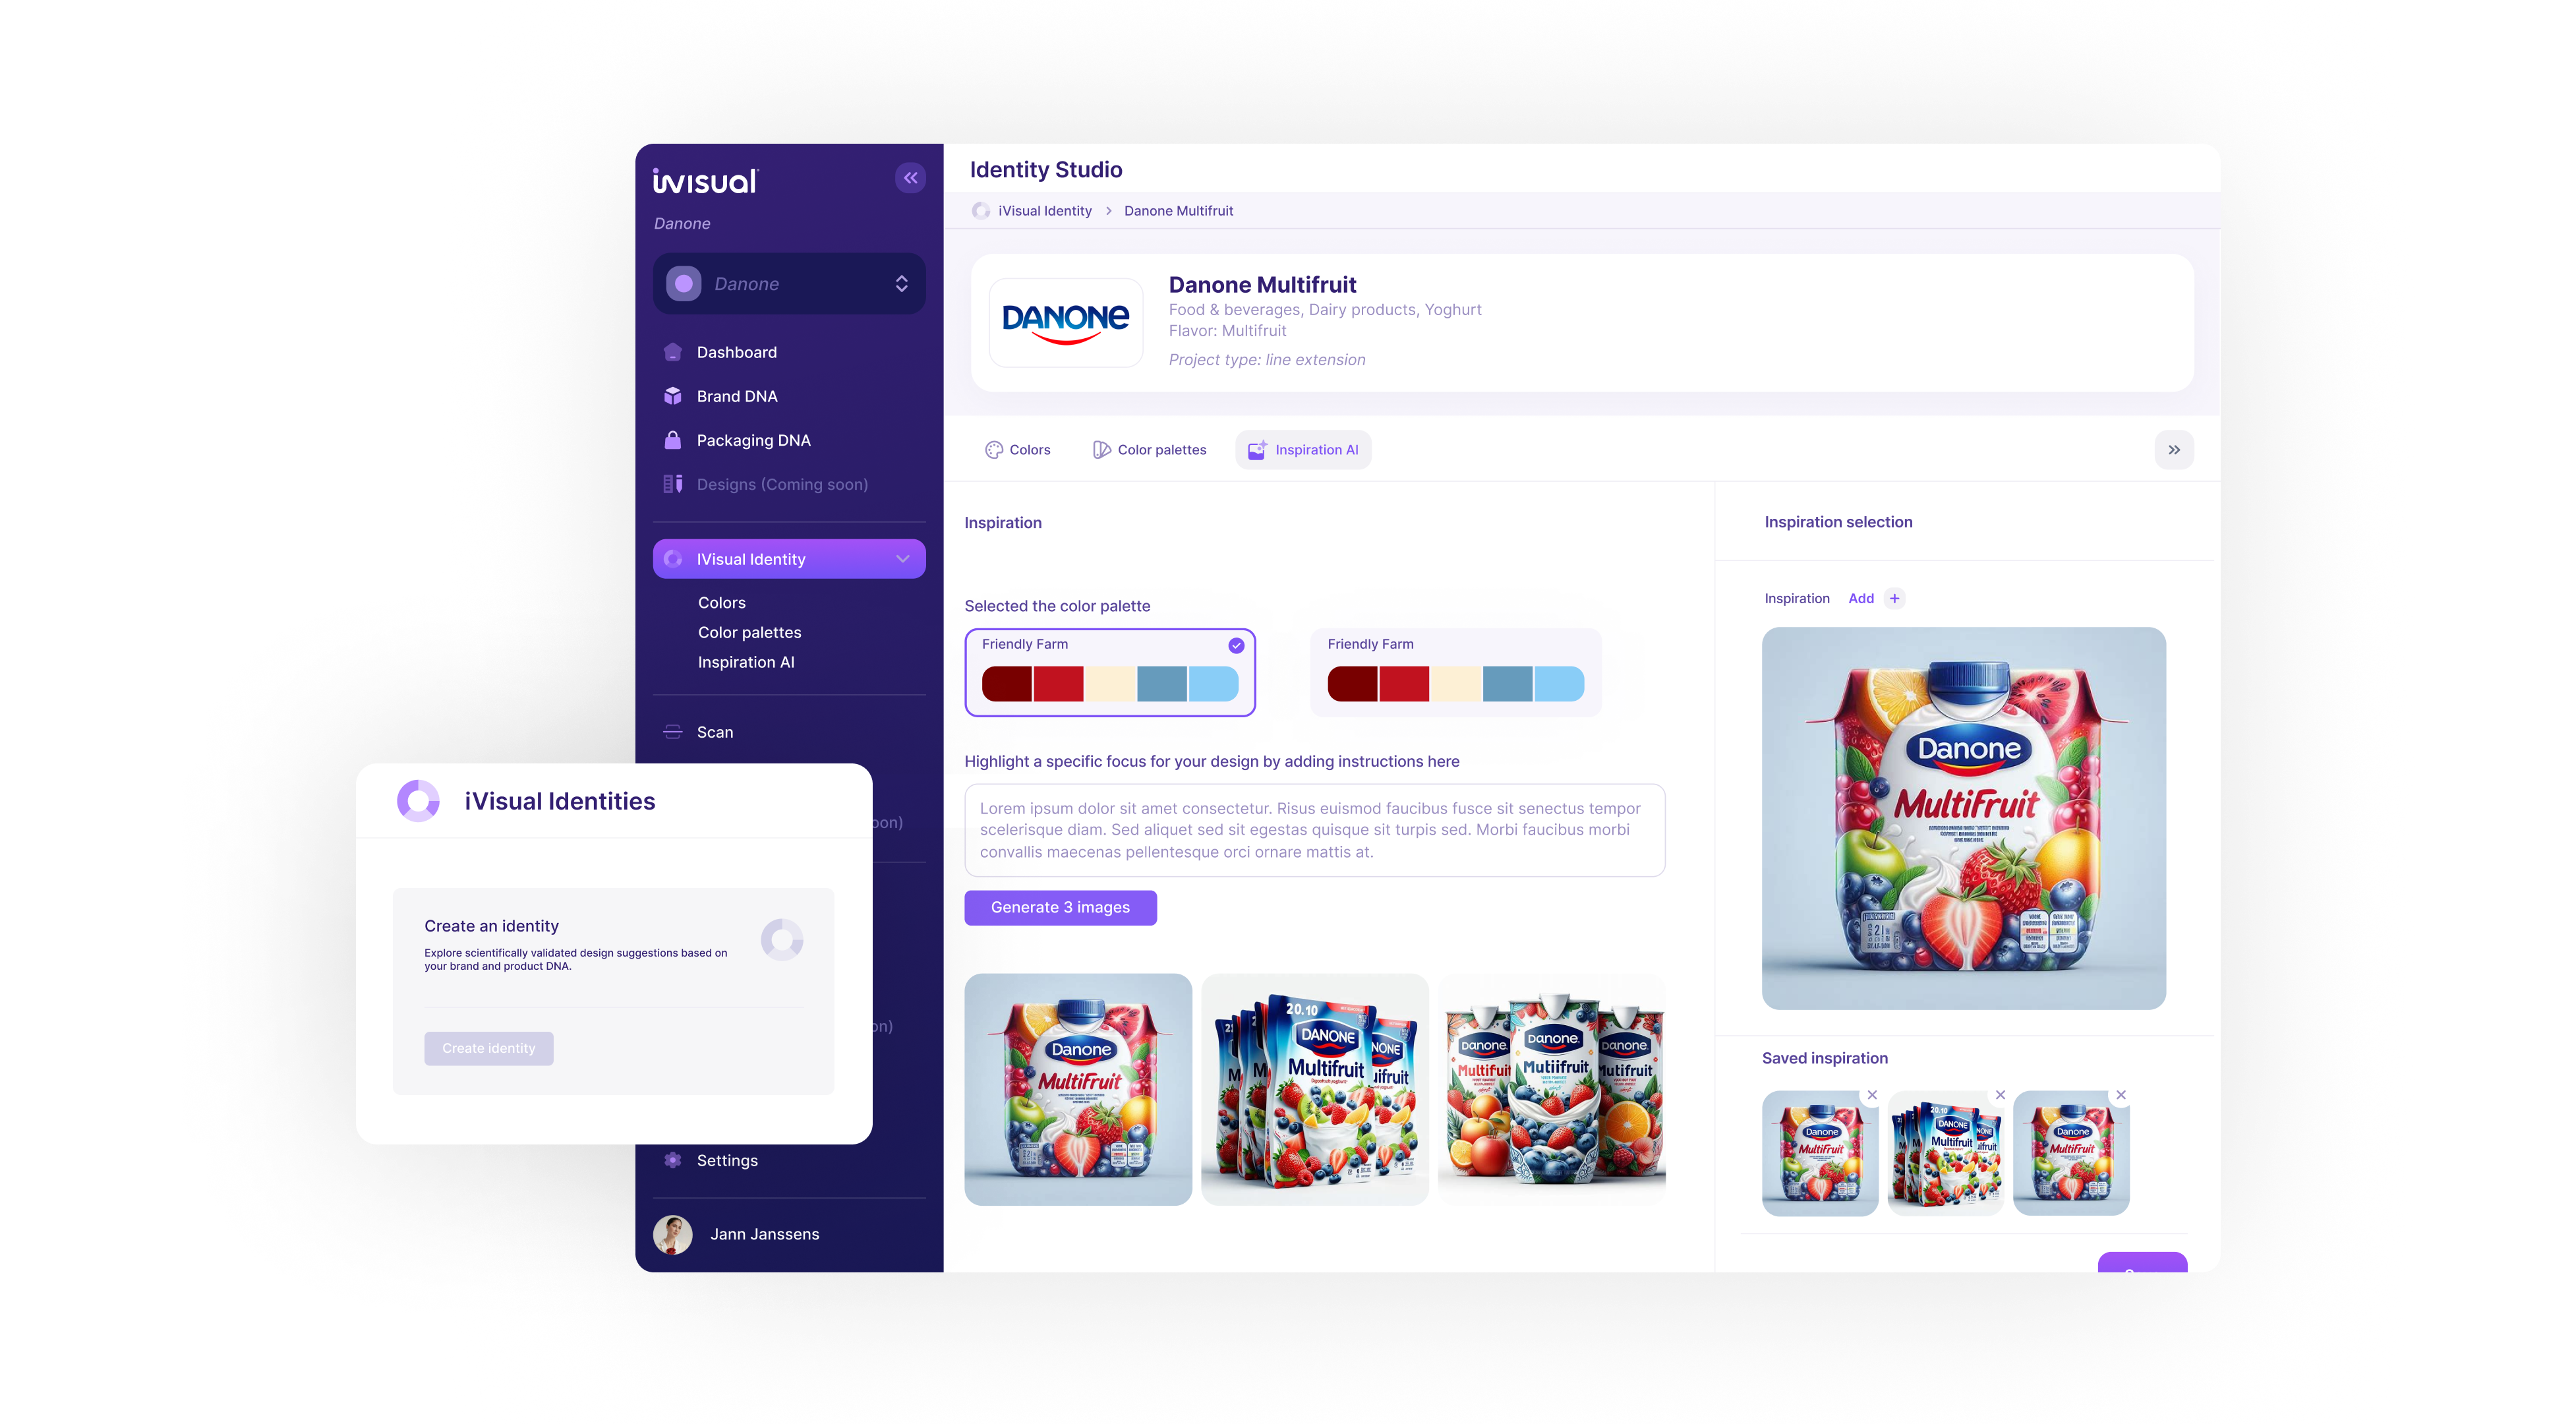
Design concepts seeded by your validated palettes and DNA, generated inside a secured, closed environment. Brand aligned by construction, not by review.
Concepts from validated palettes or uploaded artwork
Swap colours or elements on a pack instantly
Directions anchored to DNA, not to trend data
Your IP never trains external models
Module 05
Scan
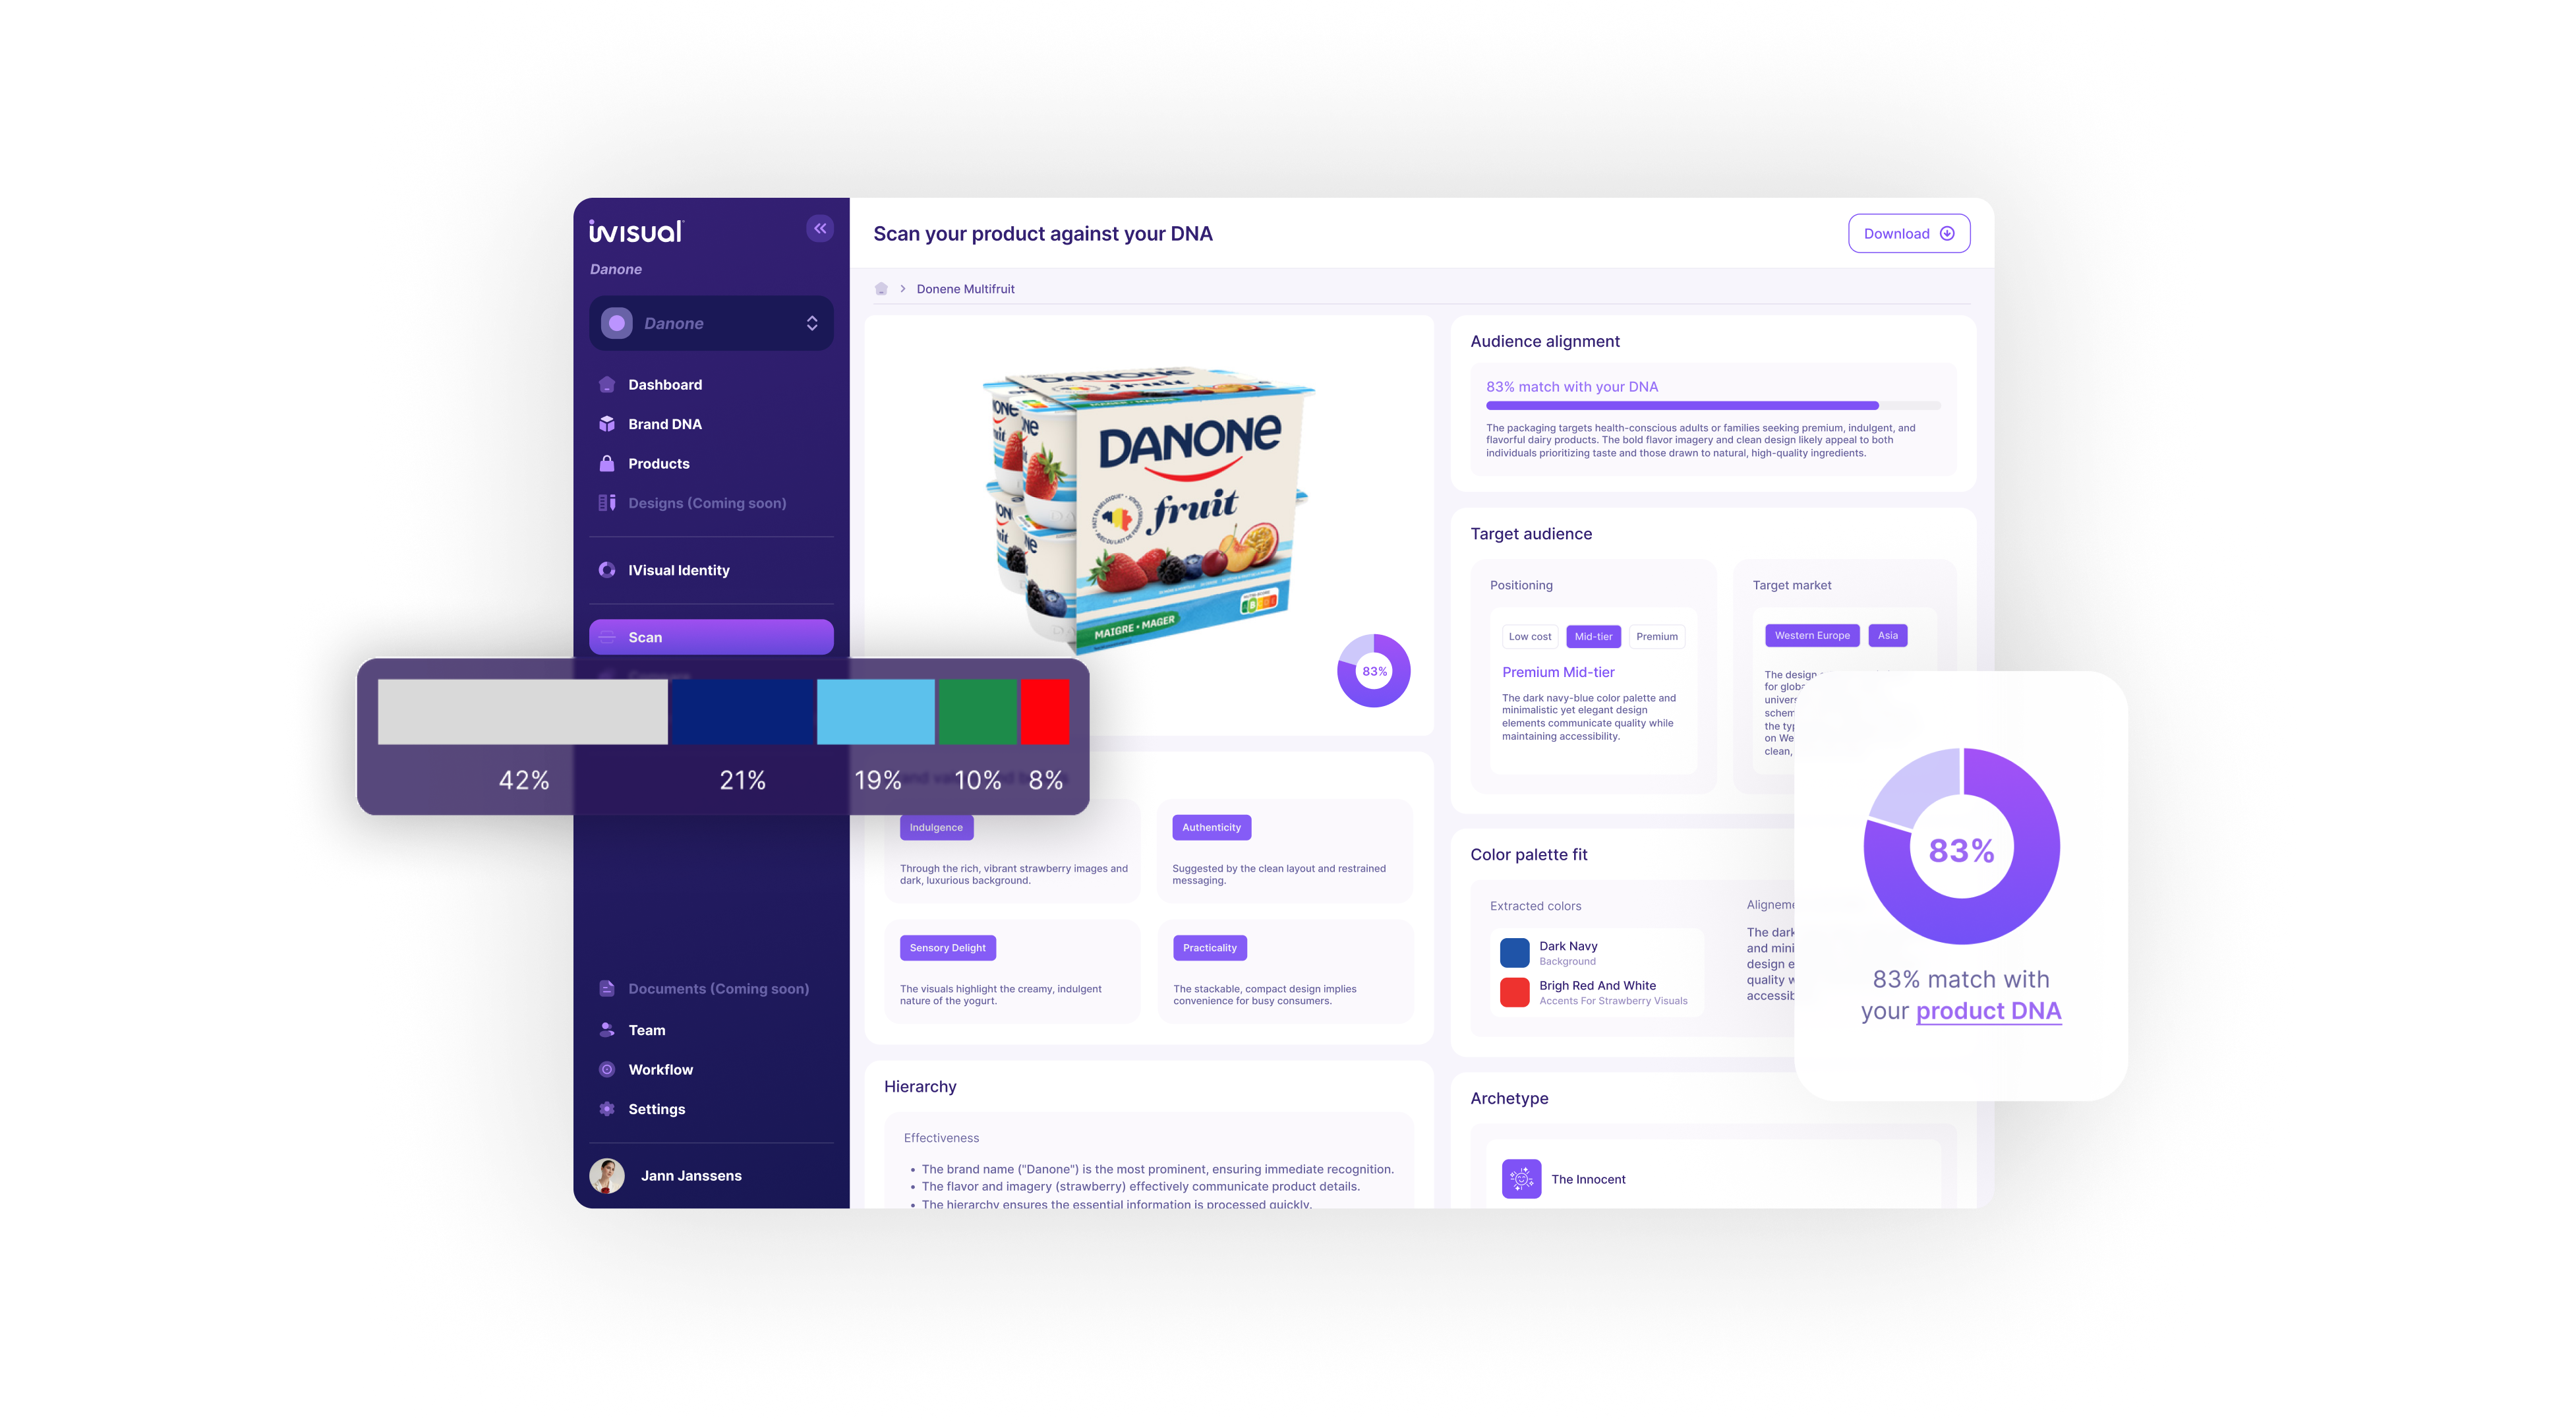
Measures a design against its own DNA. Alignment scored, not discussed. Result in under 5 seconds.
Scored against Brand and Product DNA
Typography, colour and visual hierarchy per indicator
Named corrections with the data behind them
Exportable evidence for stakeholder sign-off
Module 06
Compare
Two or more designs on identical criteria, side by side. The strongest DNA match is named, not argued.
Route comparison on one scoring model
Strongest DNA match identified per indicator
Competitor benchmark in the same workflow
Performance gap named, so revisions are directed
Module 07
Reporting
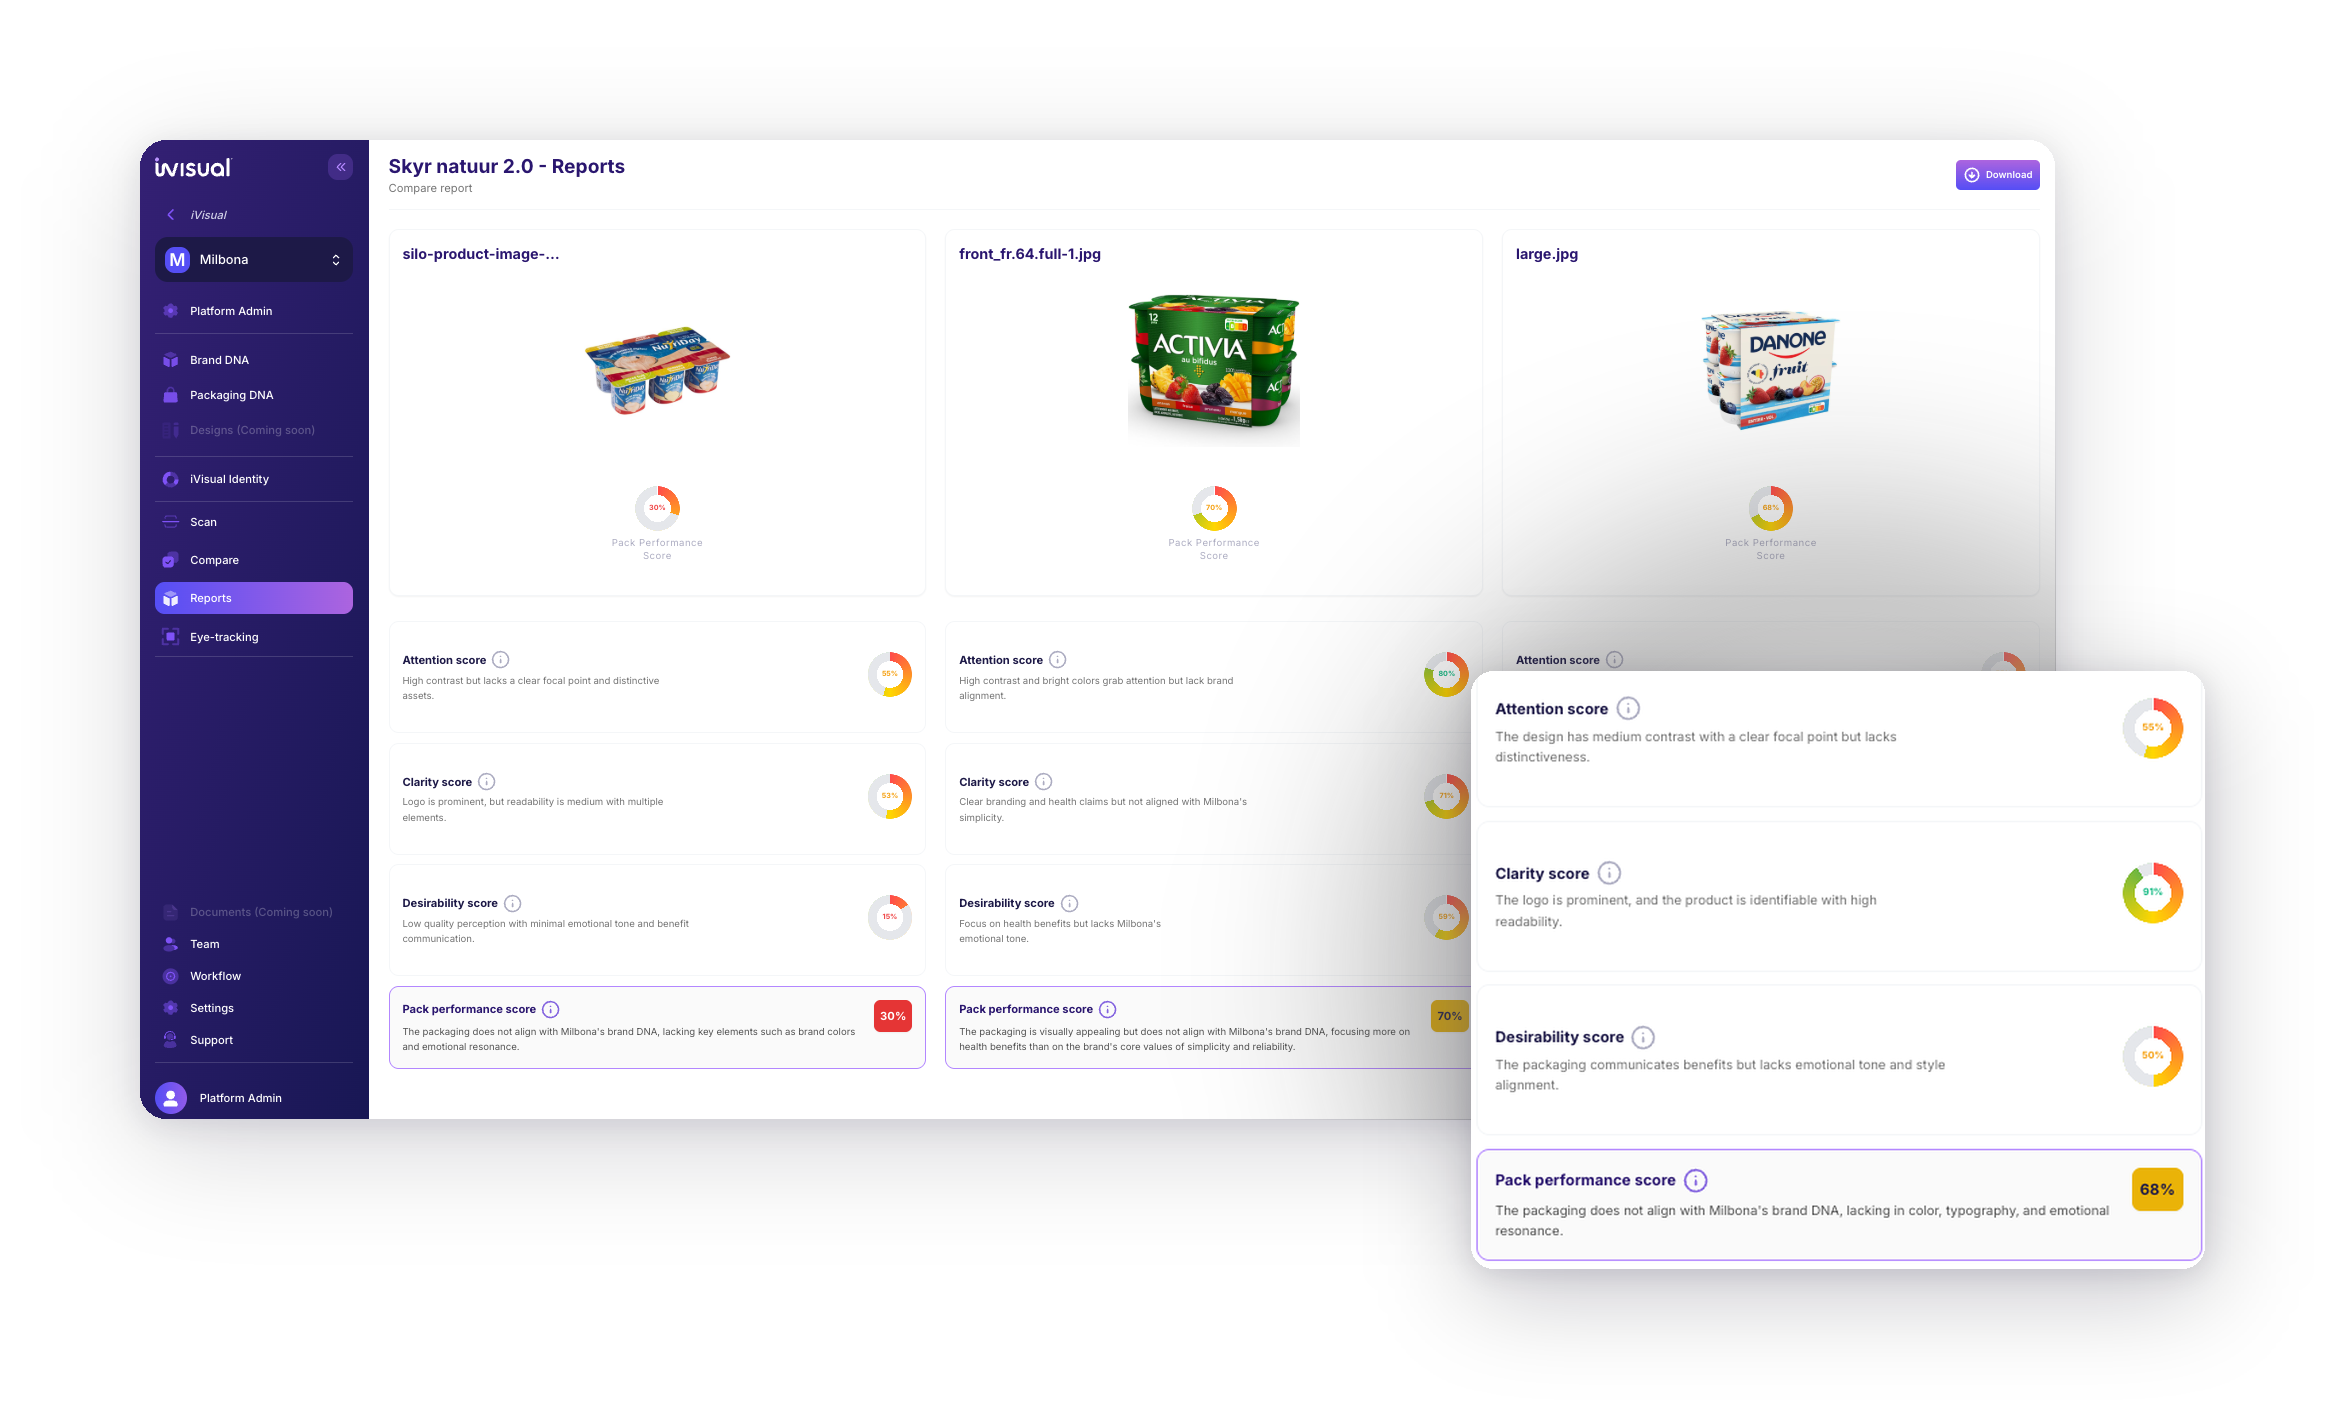
Pack performance score plus attention, clarity and desirability breakdowns, in one exportable document.
Pack performance score per design
Attention, clarity and desirability broken out
Before and after comparison per indicator
White-label export for agency partners
Module 08
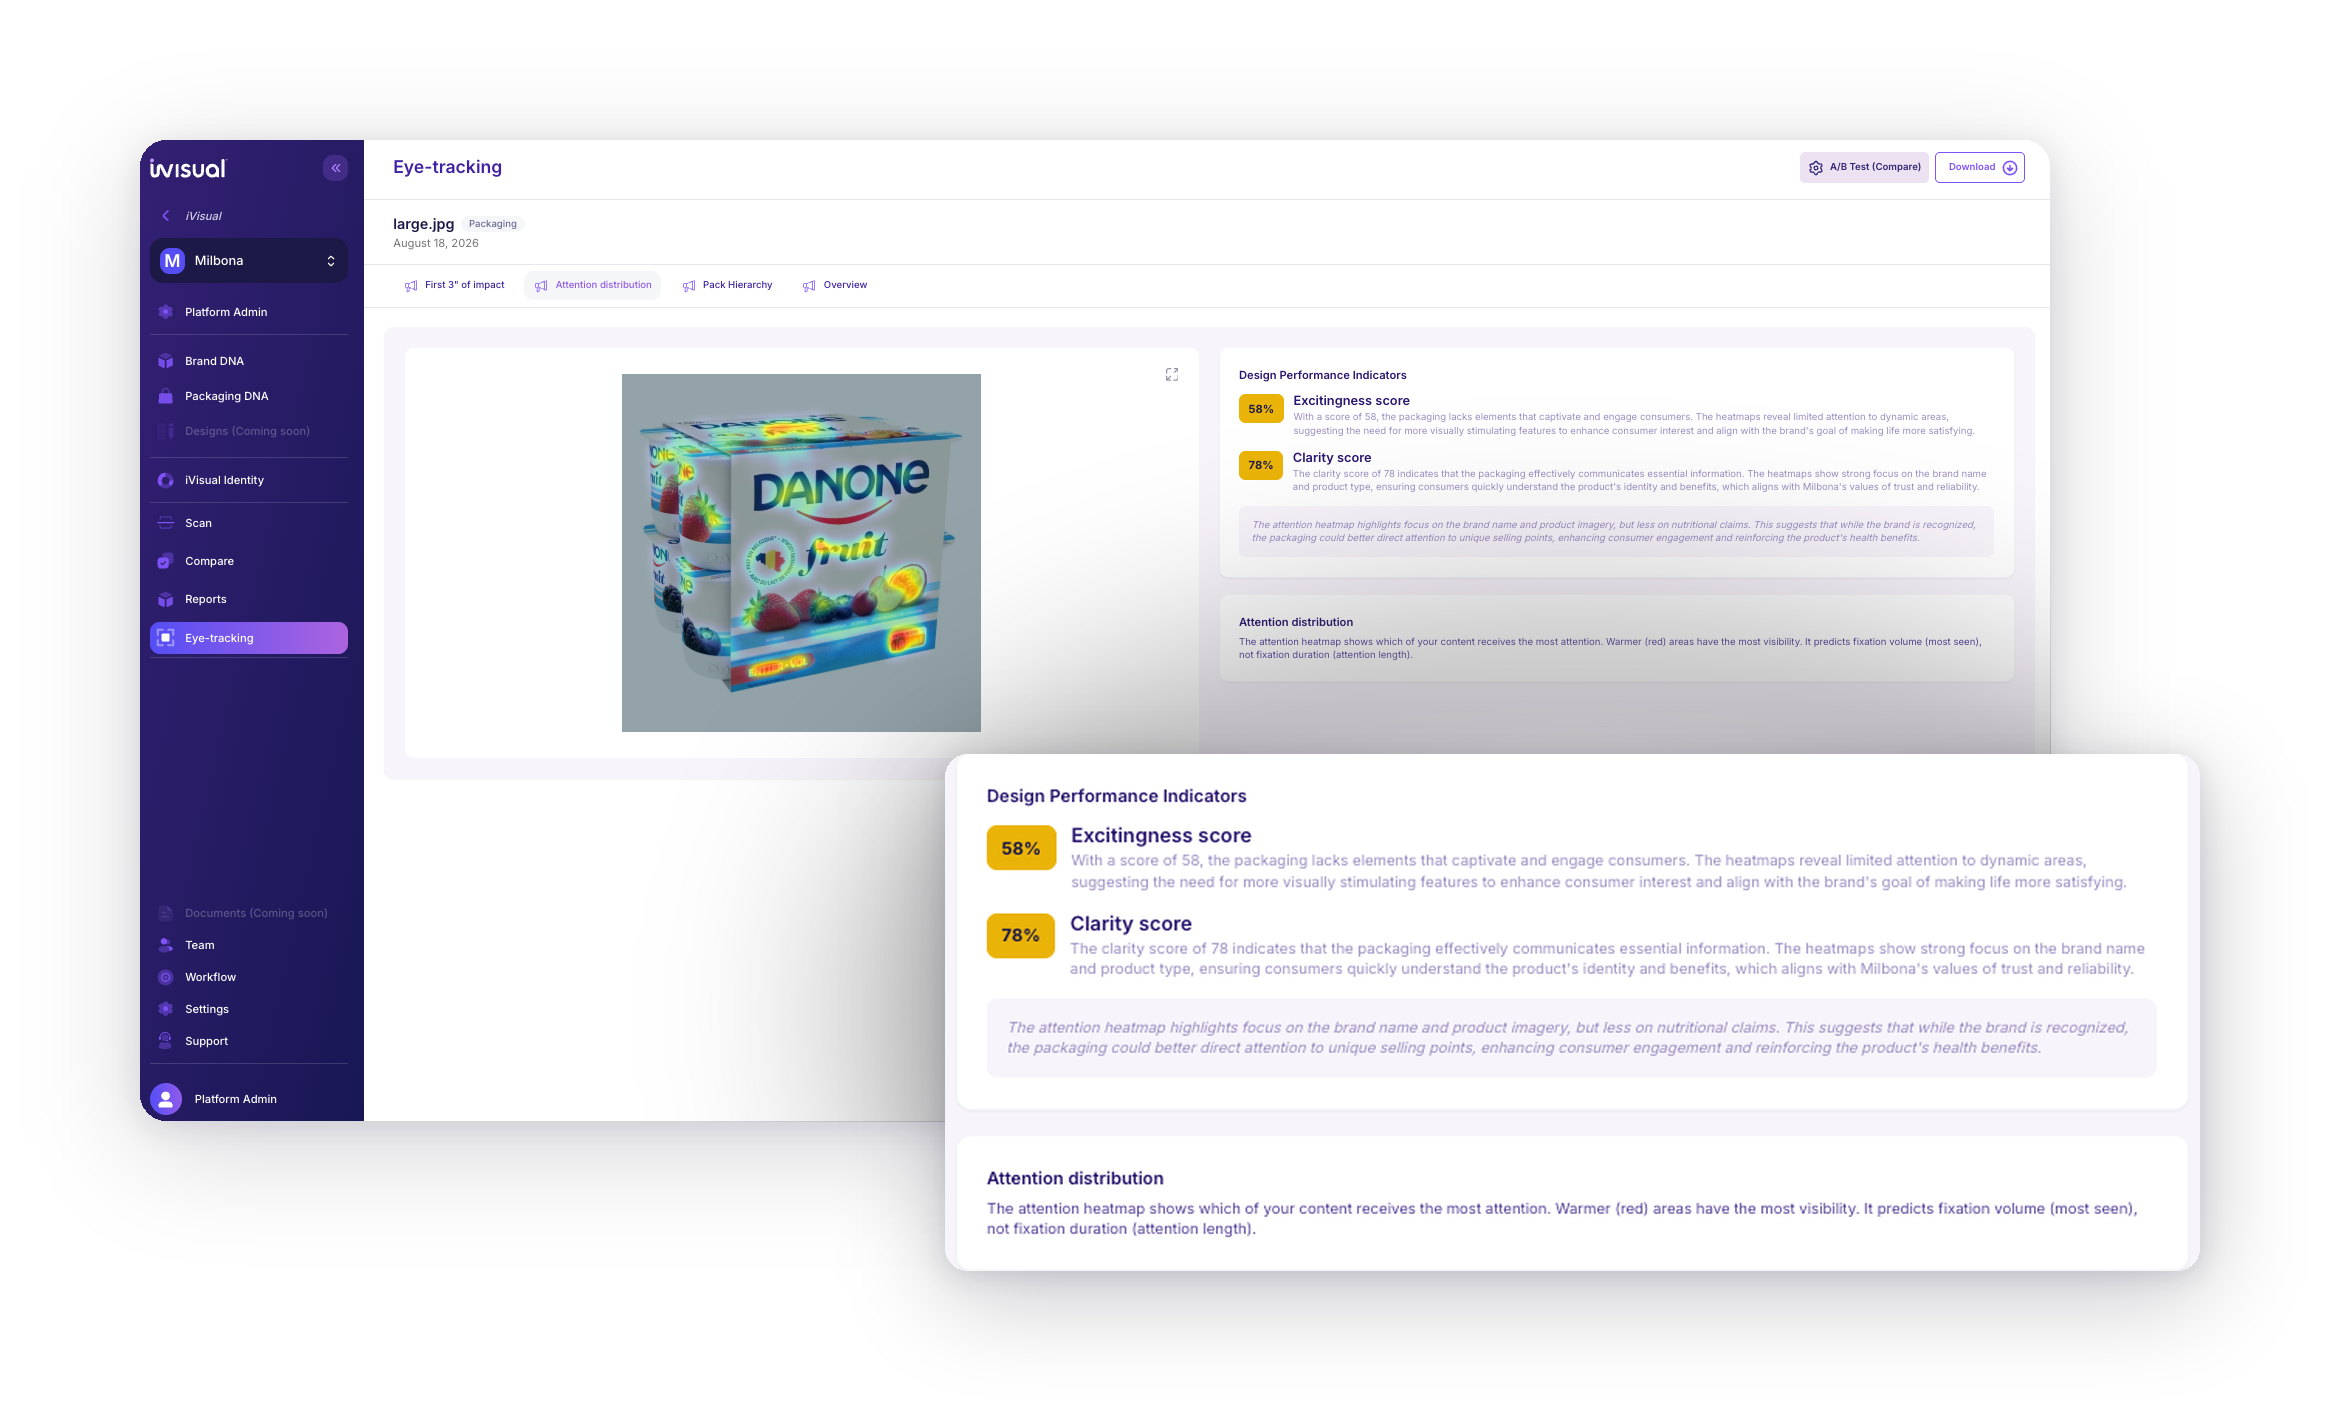
Eye tracking
Predicted attention on pack. Heatmaps, the first 3 seconds and pack hierarchy, before a single consumer sees the design.
Predicted attention heatmap per design
What the eye finds in the first 3 seconds
Pack hierarchy scored, not assumed
Built on 1.6 million eye-tracking data points
Module 09
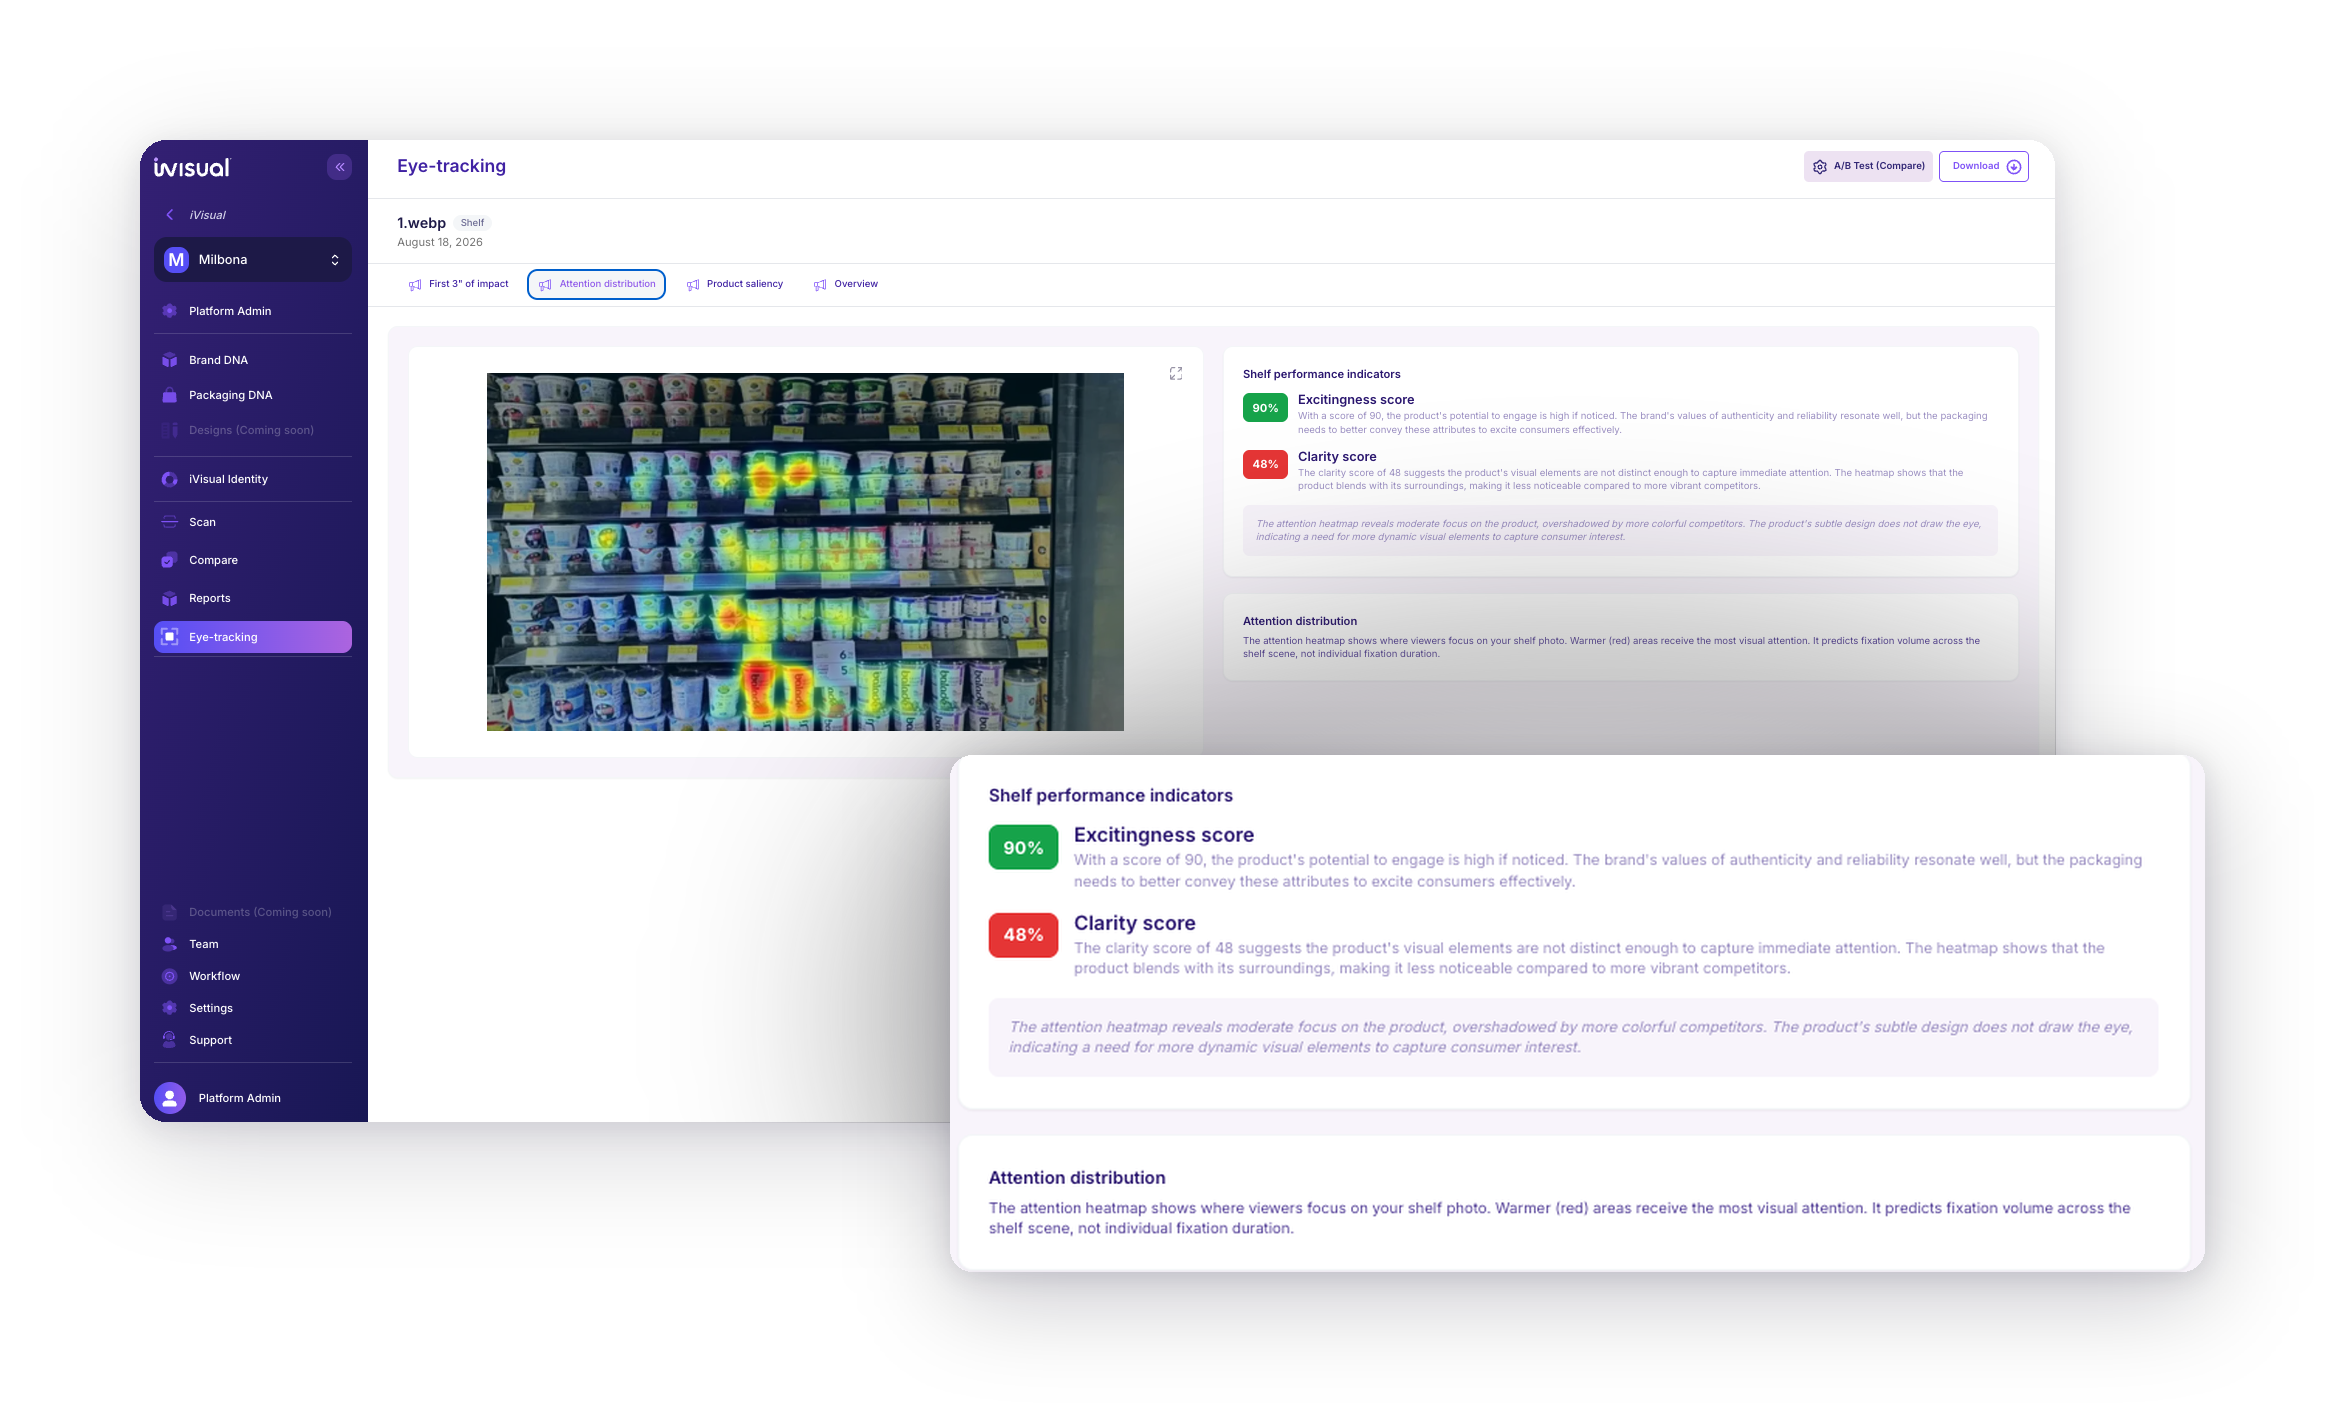
Shelf tracking
Predicted attention in a competitive shelf. Visibility and standout measured in the context the pack actually competes in.
Generative AI accelerated design production. It did not solve brand protection. iVisual runs in a closed environment, so your DNA, colour logic and competitive context stay inside your authorised environment.
No training on your dataEncrypted in transit and at restRole based access

.png)